Example: Quality controls
A typical task right off the bat in single-cell sequencing projects is to look at some statistics of the sequencing reads, for instance the number of reads for each cell (coverage), the fraction of mapped reads, and the abundance of spike-in controls and housekeeping genes.
from singlet.dataset import Dataset
ds = Dataset(
samplesheet='example_sheet_tsv',
counts_table='example_table_tsv')
print('Plot coverage')
ax = ds.plot.plot_coverage(color='blue', lw=3)
ax = ds.plot.plot_coverage(
features='other', color='red', linewidth=1,
ax=ax)
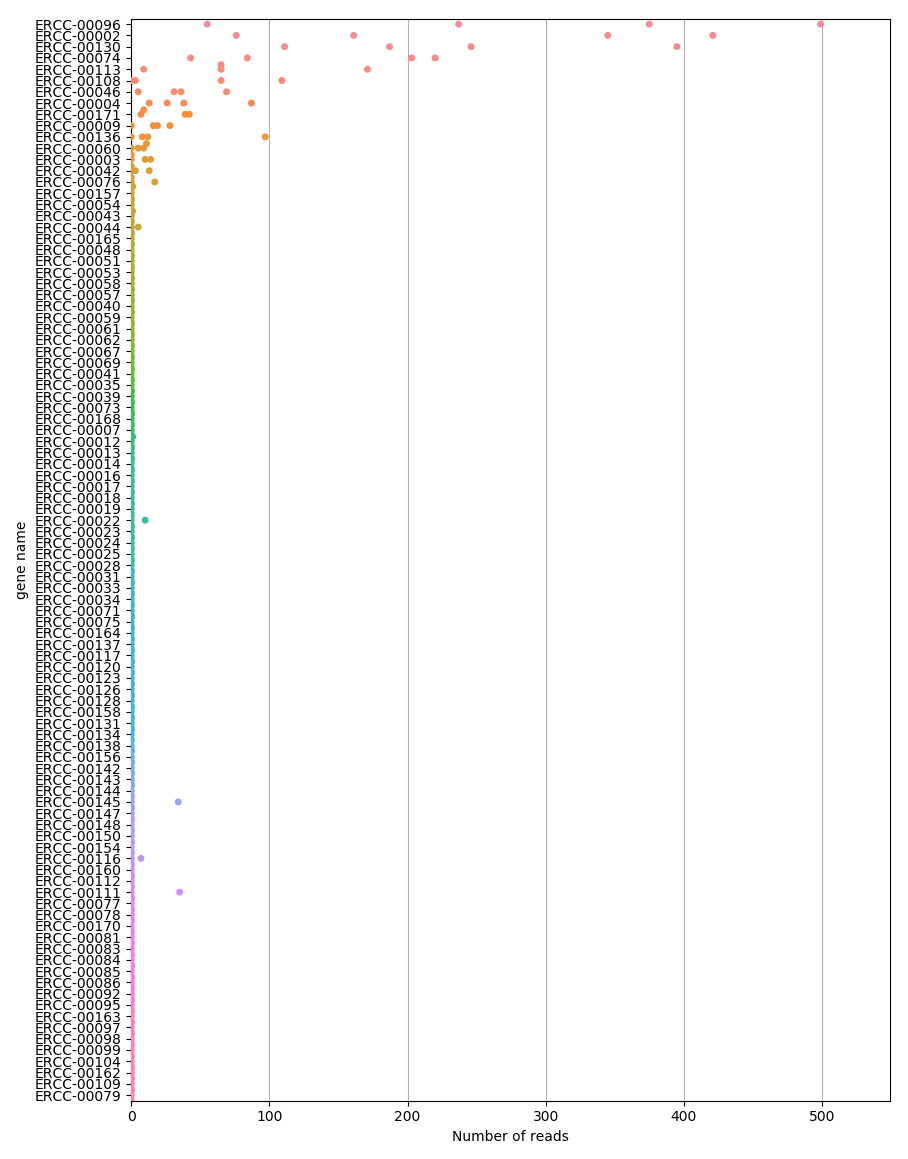
print('Plot spike-in distributions')
ax = ds.plot.plot_distributions(
kind='swarm',
features='spikeins',
orientation='horizontal',
sort='descending')
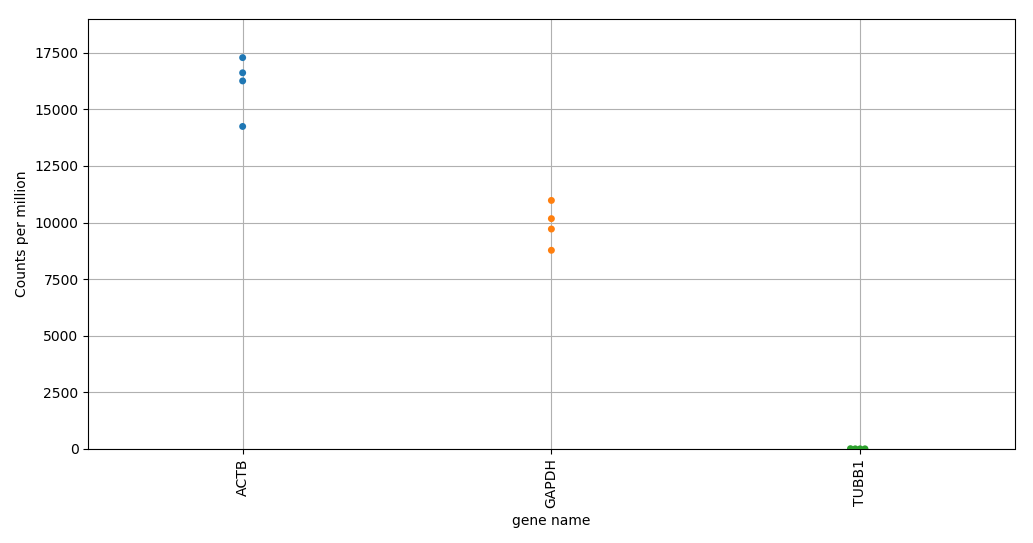
print('Plot normalized distributions of housekeeping genes')
ds.counts.normalize('counts_per_million', inplace=True)
ax = ds.plot.plot_distributions(
kind='swarm',
features=['ACTB', 'TUBB1', 'GAPDH'],
orientation='vertical',
bottom='pseudocount',
grid=True,
sort='descending')
plt.show()
You should get figures similar to the following ones: